
Are There Electrical Devices that can Measure the body’s Energy State Change to an Acupuncture Treatment? Part II, The Gas Discharge Visualization (GDV) Device
Nancy R. Roberts, Ph.D., C. Norman Shealy, M.D., Ph.D., and William A. Tiller Ph.D.
Introduction
The general field of energy medicine is growing strongly but is still in great need of reliable monitoring instruments to assess the relative energetic state of humans with respect to a healthy/pathology ratio. According to ancient Chinese medical therapy, the overall energy state and health condition of a human is largely determined by the flow of a substance called Qi through a system of channels, called meridians, distributed throughout the human body. Qi, is thought to flow into and out of the body via a network of acupuncture points and via the meridian network, to nourish various organ systems, neural systems, muscle groups, etc., of the coarse physical body(1). Imbalances between Qi flow in the various meridians is thought to over-nourish various coarse physical body systems and under-nourish others, leading eventually to different types of pathology development in such systems. Stimulation of specific acupuncture points via one of a variety of procedures, is thought to perturb the Qi-flow pattern towards optimal balance for the body and create a lessening or removal of the growing pathology. The NIH consensus report states that acupuncture has been quite helpful for lessening the severity of a variety of human disorders (2). It is therefore quite natural that commercial devices for evaluating the condition of the meridian energy state would be seriously considered by those involved in complementary and alternative medicine.
We recently selected two commercial instruments for an in-parallel study of the following question “Can they meaningfully discriminate the effects of acupuncture treatment on the body’s energy state?” In this paper, we report on experimental results using, we report on experimental results using Korotkov’s Gas Discharge Visualization (GDV) Device, a sophisticated modern-day version of Kirlian photography(3) .
In this exploratory study, 33 randomly-chosen, clinically healthy subjects were utilized in a fashion such as to act as their own control. Data from each device was gathered before and after double-blind needling at both true and sham acupuncture points. The study required two visits by each subject for needling at five different acupuncture points, one for true and one for sham needling. The single research hypothesis was “If energy is added to and/or redistributed in the body via true acupuncture needling, as contrasted with sham acupuncture needling, a worthy measurement instrument must (at least) be able to discriminate this energy change contrast in a statistically significant fashion.” Indeed, the GDV instrument passed this test with flying colors and provided much useful adjunct information as well.
Experimental Procedures
A. The Device: The GDV device is thought to work by interacting with the bio-energy field that surrounds the body and captures an aspect of it on video for diagnostic evaluation. The light from electrical coronal discharge patterns are measured at each of the ten fingers, which act as electrical termination points for the 12 main meridians of the body. These coronal discharges are thought to be a result of the human bio-energy field interacting with
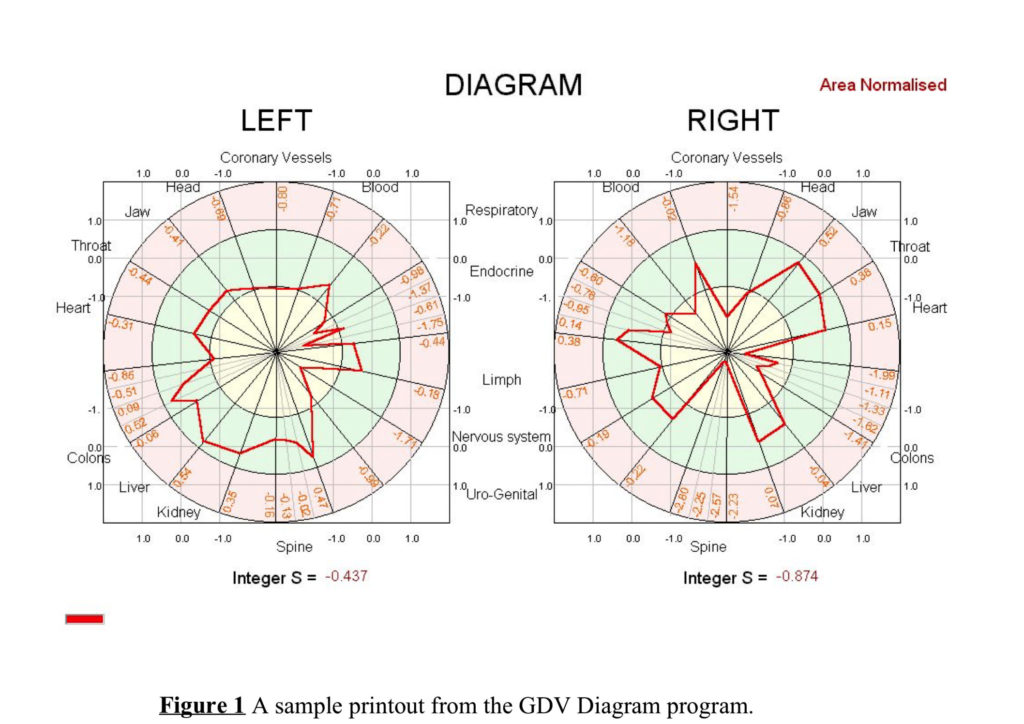
the electrical field of the GDV device. At the time of measurement, the emitted light from the interaction is captured by a video camera, and then the images are analyzed with a sophisticated mathematical tool known as fractal dimensionality. The electrical coronal discharge process, being stochastic in nature, lends itself to statistical fractal analysis, therefore providing both quantitative and qualitative diagnostic information never before available in such a non-invasive way. The GDV working parameters are the following: high-voltage impulses of amplitude +10-20 kV, impulse average period of 10 microseconds, frequency of repetition 1024 Hz, total exposure times of 0.5/ 1.0/ 2.0/ 32 sec, parameters average accuracy 1%, average supply current 300 mA, impulse current 3 A, power supply 220V 50/60 Hz or 120V 50/60hz. There is a suite of software accompanying the GDV equipment that analyzes the coronal images providing mathematical integers and coefficients that describe the energy level present in the associated meridians. The GDV diagram program results will be discussed in this paper Fig1.
B. The Human Protocol: The study required two visits, ~ 3 days apart, to the Shealy clinic. During one visit, subjects received “authentic” acupuncture and, during the second visit, they would receive “sham” acupuncture, both being administered by one us (CNS). At random, 18 of the subjects were chosen to receive authentic acupuncture during the first session, while the other 16 received sham acupuncture and vice versa for the second session. Five acupuncture points were selected for needling: LI-4, right and left (Large intestine), LR-3, right and left (Liver) and GV-20 (The Governor Vessel). The needles were left in place for 15 minutes.
C. Each subject was comfortably seated in a recliner chair within a room of comfortable temperature (~72 F). After approximately 5 minutes of acclimation to the
room, the subject’s temperature and heart rate were recorded by a nurse. At the start of each day the GDV was used for patient measurements, a set of calibration images were taken to ascertain the stability of the GDV device. Each of the patients were asked to stand in front of the GDV device while a brief description of the measurement process was explained to them.
This involved describing the placement of the hand through the light restricting sheath, and then the placement of each of the ten fingers onto the dielectric plate. Each of the ten fingers was measured, always starting with the right hand, thumb first, followed by the remaining fingers on that hand. The left hand was then measured in the same manner. These measurements were repeated three times in succession. If at any time the image captured by the GDV was not complete, the measurement was repeated for that finger until an accurate image was obtained. An accurate image consisted of proper positioning on the plate, so that the camera within the GDV captured the complete image, and the image consisted of the proper angle and pressure on the dielectric plate.
These measurements consisted of 5 total measurements of all ten fingers for both the authentic and the sham points on each subject. Baseline readings were repeated three times to assess the reproducibility of the measurements acquired by this equipment. All GDV measurements were made by (NRR).
Measure-the-body’s-Energy-State-Change-to-an-Acupuncture-Treatment