Bioelectrographic Method for Preventive Health Care
Bioelectrography for Preventive Health Care
From the early stage of bioelectrography development it was demonstrated that this approach may be applied in medicine in two main directions:
- Initial screening of patients which allows to detect mainorgans and systems of attention and direct patient to thenext, more detailed and specific diagnostic techniques.
- Monitoring of patient’s condition in the course oftreatment and rehabilitation.
Both lines have been pursued by different research groups and we present some data published after the year 2000.
Photonic emission varies from person to person and reflects his/her psycho-emotional and physical state at the moment of study. Thus, bioelectrographic approach can then be used as a model to bridge the gaps in health disparities by creating an innovative approach to address health aspects in real time measurements, which will improve rural health outcomes.
So very important question is: whether it is possible to use GDV approach for assessment of person’s health state and psycho – physiological condition? This topic was the objective of the research by [Cohly H. et.al. 2009], and the aim was to create the dataset, which could serve as a background for an alternative method of preventive diagnostics based on impulse analysis of fingertips’ photonic emission. Pilot study encompasses 130 participants of average age of 25.
The Integral area (IA), Integral entropy (IE) and activation coefficient (AC) mean values for 130 participants were recorded with and without filter. The relationship between IA, AC and IE was assessed by binary selection metric criteria. Specifically the average AC was 1.966 compared to the standard norm ranging from 2 to 4, IA was ranging from 0.3 to 0.11 compared to the standard norm ranging from -0.6 to 1.0 whereas IE was ranging from 1.94 to 1.99 compared to the standard norm ranging from 1.0 to 2.0. Thus, pilot study of a group of 130 individuals shows close agreement with the values defined as a standard norm. Binary matrix analysis of the distribution of mean values is a promising step towards defining base line values for disease profiles. The participants with health problems showed deviation from the norm towards increased activity of certain organs.
This was confirmed in several studies.
Bundzen et al [2003] after analyzing 30 people concluded that basic and integral parameters of optoelectronic emission correlates with humoral-metabolic and reflex regulation processes on the level of the autonomic nervous system. Increase in activity of central (neurohumoral) part of auto-regulative mechanisms corresponds with the increase in the optoelectronic emission processes, increase of stress tolerance parameters, and an overall functional index, and corresponds with decrease in an index of energetic deficiency.
Several significant positive correlations for the DHEA and DHEA/cortisol values with several GDV measures of general health (area integer) and fourth finger for a group of people was found in [Dunlop 2004]. GDV left hand area values (both with and without filter) were significantly correlated to DHEA and DHEA/cortisol values. The GDV filter 4L finger entropy value, reflecting the energy condition of the endocrine system, was positively correlated with the cortisol value. The following GDV scores were positively correlated with the DHEA and DHEA/cortisol ratio: the right hand area integer (filter and non-filter), the filter right fourth finger entropy value, and both the left and right fourth finger area (no filter) change scores.
A proposed complex of diagnosis criteria using multiple diagnostic approaches can evaluate the organisms’ response to therapy and assess the appropiateness of using different therapeutic influences. Using the GDV method in addition to other diagnostic approaches substantially simplifies (and speeds up) goal achievement – creating an individualized rehabilitation program and preventive recommendations [Voeikov 2004]
Classification of new patients by using a statistical model of GDV parameters coincided with the conventional classifications with an accuracy of 80%. Most information about the diseases in this experiment was derived from the finger sector -45° to 45° [Volkov 2005]..
The deviations of GDV-grams of the fingers revealed during some pathologic processes (107 people ages 18-62; 65 men, 42 women) do not always correspond to the borders of the sectors tentatively projected to particular organs or systems and quite often extend beyond these sector boundaries. For deviations showing post operative period increases, the majority of patients demonstrated disappearance of pathologic marks and restoration of integrity and saturation of energy field patterns [Kolkin 2006].
Kupeev et al [2006] after studding 73 people (ages 37-83; 31 men, 42 women) have concluded that GDV method can be used as an express- method for assessing treatment procedure effectiveness and persistency of acquired positive changes in organisms. GDV technique is quite sensitive and can detect changes in a few minutes.
Strong correlation between the GDV parameters and the diagnostic parameter measuring functional reserve capacity of a patient. This correlation has been revealed at its largest value for the filtered measures of GDV parameters on the left hand. The parameter “Number of fragments” shows large differences between ill and healthy patients at 6 of 10 fingers in the skin disease group [Gurski 2006] (328 patients).
Changes in organs and systems registered by the GDV method coincide in 60-90% of cases with changes registered by conventional diagnosis methods. Pathology initially detected by the means of GDV technique was confirmed afterwards by conventional methods in 60-70% of cases [Mamedov 2005] (more than 700 patients).
At the clinic of the Scientific Research Institute of Clinical and Experimental Lymphology of the Siberian Branch of the Russian Academy of Medical Sciences a double-blind screening examination of 100 verified patients with various pathologies demonstrated the sensibility of the GDV bioelectrography method amounted to 92% [Ignatiev et al 2000].
Examination of patients with autointoxication of various etiologies (diseases of the lymphatic system, of the digestive tract organs, etc) showed possibility to reveal and estimate the state of autointoxication by existence of markers – toxic spots of various kinds on bioelectrograms. Analysis of the data obtained from examination of 130 patients in hospital environment has proved that the bioelectrography method allows to reveal and estimate early before-clinical changes as well as hidden pathologic processes, which manifest themselves clinically later (with the period of observation from 1 month to 2 years) and are confirmed by laboratory and functional methods of research (cardiovascular pathology, diseases of endocrine, digestive, uro-genital systems and others).
Big research line was conducted at the Central Clinical Sanatorium named after F. Dzerzhinsky in Sochi, Russia, by Bikov A.T. M.D., PhD and Tchernousova L.D. M.D. [2003]. 135 people were examined with posttraumatic stress-factor disorders and 29 people with other anxiety- making disorders. 100% (164 people) of patients from these groups revealed somatic disfunction of their nervous system; 16.6% (27 people) of patients revealed changes in function of their endocrinic system-thyroid gland diseases; 11.1% (44 people) of patients revealed stomach and duodenum diseases (gastritis, duodenitis); 16.6% (27 people) of patients revealed diseases of biliferous tracts and pancreas (chronic cholecystitis, dyskinesia of biliferous tracts, reactive pancreatitis). GDV analysis of patients allowed to reveal dysfunctions not known by the previous investigations. Data presented in the Table below.
Bioelectrography for Preventive Health Care
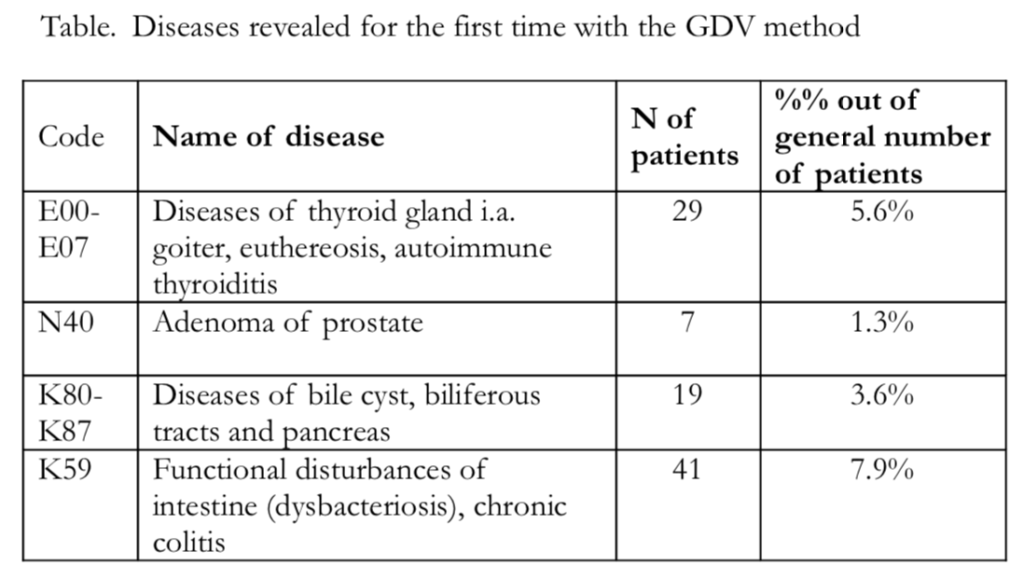
All diagnoses were confirmed by clinical and laboratory examinations.
In the research project of phtisio-pulmonology department of Kazakh State Medical University named by S.D.Asfendiarov (Alma-Ata, Kazakhstan) 107 patients (60 men and 47 women) with lungs tuberculosis was studied both with GDV method and with classical technologies. 30 healthy people served as control [Shabaev et al 2004]. Clear statistical difference between healthy and deceased people, as well as high correlations (on the level 0.7-0.9) between GDV indexes and clinical parameters of patients were found. Another studied group included 195 patients (60% – women), bearer’s of a profound mycosis fungoides infection – P. Variotii Bainier (1907), var. Zaaminella Dechkan (1974). Profound GDV-gram changes were noted in cases with eosinophilic reaction in blood correlated with anemia and decrease of immune status. These particularities could be connected with different biochemical basis of inflammation, but namely, with different stage of free-radical processes activation.
Monitoring of patents’ condition after rehabilitation process is being used for many years since 2002 at the Centre of psychological research of Russian Ministry of Railway Transportation in Saint Petersburg [Sergeev et al 2004]. The short-term rehabilitation is designed for 6 hours. The doctor nominates necessary procedures depending on a condition of health and presence of problem zones, and traces changes after rehabilitation. After the ending procedures the card displaying dynamics of a condition (results of psychological diagnostics and the GDV analysis) is given out. After that results are discussing with the psychologist. After rehabilitation the GDV- gramms of fingers are characterized by the greater area, greater isolation and uniformity of a luminescence in relation to GDV-gramms before rehabilitation.
In this study correlation between GDV area and arterial pressure was found. Increase of arterial pressure corresponded to a smaller area of a luminescence (k = -0,320, р=0,01). Similar a pulse rate was correlated to the integrated area of a luminescence (k = -0.240, р=0.01), and pulse pressure (k = -0.272, р=0.01). The parameter of fractality without the filter had direct correlations with systolic (k= 0.325, р=0.01) and diastolic arterial pressure (k = 0.265, р=0.01). Increased fractality corresponded to increase of arterial pressure.
Interesting study was presented by [Abadi et al 2005]. They decided to compare informativeness of devices designed for measuring Human Energy Field. The four devices comprise: Gas Discharge Visualisation (GDV), Electro Scanning Method (ESM), Polycontrast Interference Photography (PIP) and Resonant Field Imaging (RFI). Each device delivers the information in different formats. Both RFI and ESM provide raw data (frequencies), which in the case of RFI is then used to build up an image, whereas in ESM no computer software is involved and the raw data is used in analysis. With PIP, the process of data collection and image creation is automated. GDV builds up an image based on readings taken at the fingertips.
10 participants were chance selected; each requested to complete a body perception questionnaire, in which they identified current and past health issues. The four scanning sessions for each participant took place on the same day and in the same order. The scans were interpreted by experts using qualitative analysis and compared to the health data from the client questionnaire.
Eachofthedeviceshasevidencefromcasestudies, thathasbeen able to demonstrate the possibility of identifying areas of physical and mental imbalance from scans. To date however only GDV has published research in peer review journals.
A blinded clinical study was performed by Prof. A.L. Tumanova at the Sochi University, Russia [Tumanova 2007], where 542 patients were separated in two groups. The first group was first analyzed with EPI /GDV and after that with ordinary medical examinations. The second group was first examined by a medical doctor and thereafter a EPI /GDV Analysis was done. The medical parameters included analysis of the cardio-vascular system with daily monitoring, of the bronchial system, the digestive tract, the spine and muscular system as well as blood, urine and hair tests. The study revealed a correlation of EPI /GDV Analysis Data with clinical examination for the first group between 82 and 89% and a predictive power of the EPI /GDV analysis prior to the medical examination of 94%. The correlation of the EPI /GDV Analysis with the results from the medical examinations for the second group (first medical examination and EPI /GDV Analysis afterwards) was 79%. The conclusion from this study was that the Analysis of EPI /EPI /GDV data was most gainful in cases of early diagnosis of pathological conditions. The advantages of the EPI /EPI /GDV approach were found in the ease in use, economical, fast, non-invasive, reliable and informative method of information gathering and diagnosis.
The meta-analysis of papers published in English or Russian language from 2003 to 2007 was presented in “The Journal of Alternative and Complementary Medicine”. [Korotkov, Matravers et al 2010] “All randomized controlled studies (RCTs) and systematic research reports (SRRs) were evaluated using Scottish Intercollegiate Guidelines Network and Jadad checklists. The search yielded 136 articles addressing four different fields of medical and psychophysiologic applications of EPI (GDV). Among them 78 were rated ‘‘high’’ on the two conventional checklists. 5303 patients with different problems were compared to more than 1000 healthy individuals.
In the work by [Yakovleva et al 2008] correlations between parameters of the Ultrasonic Dopplerography of main brain arteries (USD MBA), Echocardiography (EchoCG) and Gas Discharge Visualization (GDV) were studied. 303 patients were examined by GDV and EchoCG methods and 43 patients by GDV and USD MBA.
Patients studied by USD of magisterial arteries of the head were divided to three groups in accordance with the level of vessels damage. Correlation analysis was done both for the whole set of subjects and for every particular group. For the whole group correlation between GDV and USD data was weak. For the particular groups correlations coefficients were moderate and strong with the level of significance р< 0.05 – 0.01. Different correlations were found both for all 10 fingers and for the sectors related to head zone at 1, 3 and 4 fingers; and in the sector of blood circulation. The highest correlations were noted at the first stages of the illness, that confirm the thesis of prognostic effectiveness of the GDV approach. Variations of vessels structure (stenoses, coilness, variation of diameter, etc.) were reflected on all GDV parameters. Presented results suggest existence of a linear dependence between data of Ultra-Sound Dopplerography of the magisterial arteries of the head and GDV parameters.
No linear correlations between Echocardiography and Gas Discharge Visualization (GDV) data were found.
The aim of the study [Ciesielska-Wrobel et al 2010] was to assess changes in EPI images in patients with cardiovascular diseases. The study population of 126 persons (81 men and 45 women) was divided into two groups: the study group consisted of 96 patients with coronary heart disease and the control group composed of 30 healthy persons. The study methods included recording of corona discharges of fingertips of both hands by using the Gas Discharge Visualization (GDV) Camera and analyzing changes in images dependent on conditions of medical examinations of patients, their frame of mind, age, gender, heart rate, blood pressure, serum potassium concentration, and the course of coronary heart disease.
Results: Age, gender, temperature in examination rooms as well as frame of mind of the study population exerted a similar effect on EPI in both groups. Heart rate, blood pressure and the pattern of coronary heart disease exerted varied effects on the patients’ EPI parameters in the study group. Conclusions: The analysis of changes in EPI may be a source of information about the effect of physiological and pathophysiological changes in the human health state, physical as well as mental.
Detailed discussion of the principles of Electrophotonic analysis is presented in the book “ENERGY FIELDS ELECTROPHOTONIC ANALYSIS IN HUMANS AND NATURE” by K. Korotkov available in electronic format.
GDV/EPI Bioelectrography Research and Kirlian Photography on IUMAB Library
GDVCAMERA – Stress & Energy level measurement
Welcome to IUMAB!