
Electrophotonic Imaging Technology in the Diagnosis of Autonomic Nervous System in Patients with Arterial Hypertension
Korobka I.E, Yakovleva E.G., Korotkov K.G., Belonosov S.S., Kolesnichenko T.V.
1 Pirogov Russian National Research Medical University, Russia
2Department of Mechanics and Optics, St. Petersburg Federal
University of Information Technologies, Russia
*Corresponding author: Konstantin G Korotkov, St.
Petersburg Research Institute of Physical Culture and Sport,
NIIFK, Ligovski prospect 56E, St. Petersburg, 19104 , Russia,
Received: October 30, 2017 | Published: January 31, 2018
Abstract
Objective: To study the difference between patients with arterial hypertension and healthy people on the activity of brain functions and autonomic nervous system.
Materials and Methods: 138 patients (32 healthy and 106 patients with
arterial hypertension) aged 20 to 70 years were examined using the methods of Electrophotonic imaging (EPI or gas discharge visualization GDV) and heart rate variability (HRV).
Results: The analysis of the data revealed statistically significantly different EPI/GDV parameters in patients with arterial hypertension and healthy subjects. The values of the medians of parameters indicated the activity of the right hemisphere of the brain in patients with hypertension, most pronounced in individuals with the II degree of the disease. The comparison also revealed statistically significant difference in the index of stress of regulatory systems, while in patients with arterial hypertension it was much higher than normal.
Conclusion: The possibility of identifying patients with high functional activity of the right hemisphere of the brain using the method of EPI/GDV can serve as one of prognostic factors of the arterial hypertension. Such diagnostic capability of the method can be particularly useful, for example, in case of timely detection of latent forms of hypertension.
Keywords: Electrophotonic imaging; Gas discharge visualization; Arterial hypertension; Right hemisphere
Abbreviations: HRV: Heart Rate Variability; GDV: Gas Discharge
Visualization; EPI: Electrophotonic Imaging; ANS: Autonomic
Nervous System; AH: Arterial Hypertension
Introduction
A significant prevalence of arterial hypertension (AH), its
role in the early decline of health, disability and mortality
determined the relevance of this study. Despite the fact that the
history of the study of AH has more than 130 years, if counting
from the appearance of the first devices for measuring blood
pressure, there are still many unclear and controversial issues
in the pathogenesis of this disease and in the development of the
most effective methods, tools and schemes for its treatment [1].
However, there is no doubt that the effectiveness of AH treatment
is determined by the knowledge of the pathogenic mechanisms of
its development and stabilization.
The complexity of the study of hypertension is due to the
multifactorial nature of its etiology, the variety of manifestations
and the involvement of almost all systems of the body in its
development. Furthermore, it is known that the pathogenesis of
this disease has gender differences [2]. Studies of hypertension
indicate the cerebral hemispheres dysfunction in patients with
this disease. While more and more scientists are inclined to believe
that a significant role in the formation of the AH should belong to
the right hemisphere of the brain. This is also confirmed by the
relationship between the functioning of the right hemisphere and
blood pressure [3,4].
Modern methods of AH diagnostics open up prospects for new
approaches to the study of the unsolved problems in the formation
of AH, and hence to the search for more effective treatments for this
disease. In our work an attempt was made to use for assessment
of the functional state of the right hemisphere of the brain one of
these new methods of bioelectrography Electrophotonic imaging
(EPI/GDV). This method has found applications in the study of the
functional activity of the organism in a wide range of diseases [5-
8].
Materials and Methods
EPI/GDV method is based on mathematical analysis of the
parameters of the glow of the skin stimulated by the pulses of
electric field [5]. This is one of the few diagnostic methods to
assess the state of the organism as a whole as well as of individual
organs or systems. It is also possible to examine the functioning of
the hemispheres of the brain.
In addition to the EPI/GDV, the method of heart rate variability
(HRV) was used in the study. This is a method of registration of the heart sinus rhythm with subsequent mathematical analysis.
138 people of both genders (65 men and 73 women) aged 20
to 70 years served as subjects in the study. Of these, 32 healthy
volunteers formed the control group and 106 the group of
patients with hypertension. The hypertension group consisted of
39 people with AH of I degree, 54 with AH of II degree and 13 with
AH of III degree. 95% of subjects according to their subjective
opinion were right-handed. Almost all the hypertension patients
were constantly taking drugs to reduce blood pressure. Before the
study medications were canceled. Examination of patients was
carried out consistently in the first half of the day (from 8 to 12
hours), before meals.
The analyzed subjects have been selected on the basis of data
of the patients of the Hospital №85 of FMBA of Russia, Moscow
and submitted to the Department of functional diagnostics
by various indications. The diagnosis of hypertension was
staged in accordance with the recommendations of the Russian
scientific society of cardiology [9]. Among patients with arterial
hypertension 14.4% were diagnosed for the first time, the rest
85.6% had this disease from 3 to 15 years. The age range was 20
– 70 years.
Exclusion criteria
Patients with disturbance of the rhythm or conduction of
the heart (frequent extrasystoles, atrial fibrillation, sinoatrial
and atrioventricular block), as well as patients with implanted
pacemaker. Women in menstrual period.
In accordance with international standards of interpretation
of the results of the heart rate variability proposed in 1996 by the
European society of cardiology and North American society of
synthesis methods [10], patients with arterial hypertension were
divided into two groups according to the value vago-sympathetic
index (LF/HF ≤ 2 and LF/HF > 2) and two groups according to the
value of the index of tension of regulatory systems (SI ≤ 150 and
SI > 150).
For the HRV analysis, the device “Polispektr” (“Neurosoft,”
Russia www.neurosoft.ru/eng/) was used. The entry consisted of
5 minutes of ECG recording (no less than 300 cardio cycles) in the
supine position. The study included only patients with sinusoidal
rhythm without the presence of frequent extra systoles. For the
GDV analysis, the devices “GDV Pro” and “Bio-Well” (“Bio-Well,”
USA, Estonia) were used.
Statistical processing
Character of distribution of investigated parameters was
performed using Smirnov color criteria test; statistical differences
was tested by Mann-White U-criterion, frequencies difference by
Tony Fisher criterion. For building decision rules discrimination
and logistic regression analysis were applied. Data processing was
done using MS Office Excel, SPSS 17.0 and Statistica 7.0 programs.
Results
To identify differences between the control group (32 persons)
and the group of patients with hypertension (106 people) 224 EPI/
GDV indexes (112 right and left hands) and HRV index of tension
of regulatory systems (SI) were selected. Statistically significant
differences (p<0.05) were detected for 53 EPI parameters, 19 of
them for the right hand and 34 for the left. Moreover, among the
parameters of the right hand 7 related to the whole hand, while
12 to different sectors, reflecting the state of the nervous system,
cerebral cortex, hypothalamus, hypophysis, epiphysis, adrenal
glands, heart, vascular system, vessels, brain, kidneys. Among the
indexes of the left hand 10 related to the whole hand, while 24
to the sectors of nervous system, cerebral cortex, hypothalamus,
pituitary gland, pineal gland, adrenal glands, heart, vascular
system, cerebral vessels, left and right parts of the heart, coronary
vessels and kidneys.
Thus when comparing control group with a group of
hypertension patients the asymmetry in the number of
significantly different parameters with a predominance of EPI
parameters of the left hand was revealed. It should be noted
that such differences can be traced both in the parameters
characterizing the luminescence of each finger as a whole, and
sector parameters reflecting the condition of specific organs and
organ systems.
Because the left hand carries information about the right half of
the cerebral cortex [5], such laterality confirms the literature data
indicating increased functional activity of the right hemisphere in
individuals with hypertension [11].
The group of patients with hypertension was as well
statistically significantly different from the control group (p<0.05)
on the HRV SI parameter. In the control group the SI median
and the 25th and 75th percentiles (interquartile range) were
respectively 82.46 (49.13; 129.21) and in the group of patients
with hypertension 182.68 (109.97; 322.80). The SI norm is in the
range from 80 to 150 [14], so its high value in the group of patients
with hypertension indicated the high degree of centralization of
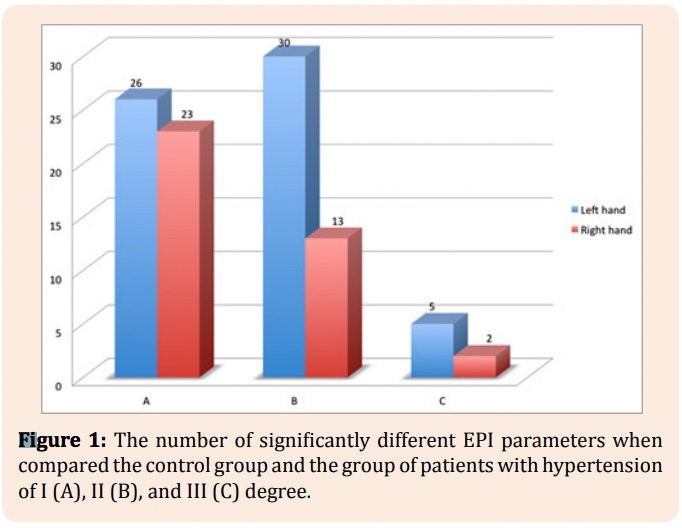
heart rhythm control. The number of significantly different EPI
parameters when compared the control group and the group of
patients with hypertension of I, II, III degree is presented at Figure
1.
Thus, in each of the comparisons there is asymmetry in the
amount of statistically significantly differing EPI parameters
with a predominance of those on the left hand. It’s expressed
Fig1
Full text: 2018 GDV/EPI Hypertension